Deploying Grafana on Amazon ECS using Fargate
A walkthrough of how I deployed a Grafana using Amazon ECS with fargate.
I was tasked with deploying Grafana on the cloud using Amazon ECS and Fargate. It was my first time doing this, so I learned a lot. If you’re also starting out, this post is for you.
What is Grafana?
Grafana is an open-source platform that helps you visualize data from different sources like AWS CloudWatch, Prometheus, MySQL, and more.
It's mostly used for monitoring, and it runs on port 3000 by default.
Tech Stack
- AWS ECS (Elastic Container Service) to manage the container
- Fargate so I didn’t need to manage servers manually
- Docker Hub as the image source
- Security Groups to allow external access
Project Description
- Deploy Grafana using Amazon ECS with Fargate
- Use the official Docker image:
grafana/grafana - Create a task definition that exposes port 3000 and run it on a public subnet
- Ensure security group allows inbound traffic on port 3000
- Once the service/task is running, open a http://
:3000 in your browser
Step-by-Step: How I Did It
Here’s exactly how I went from zero to Grafana running in the cloud.
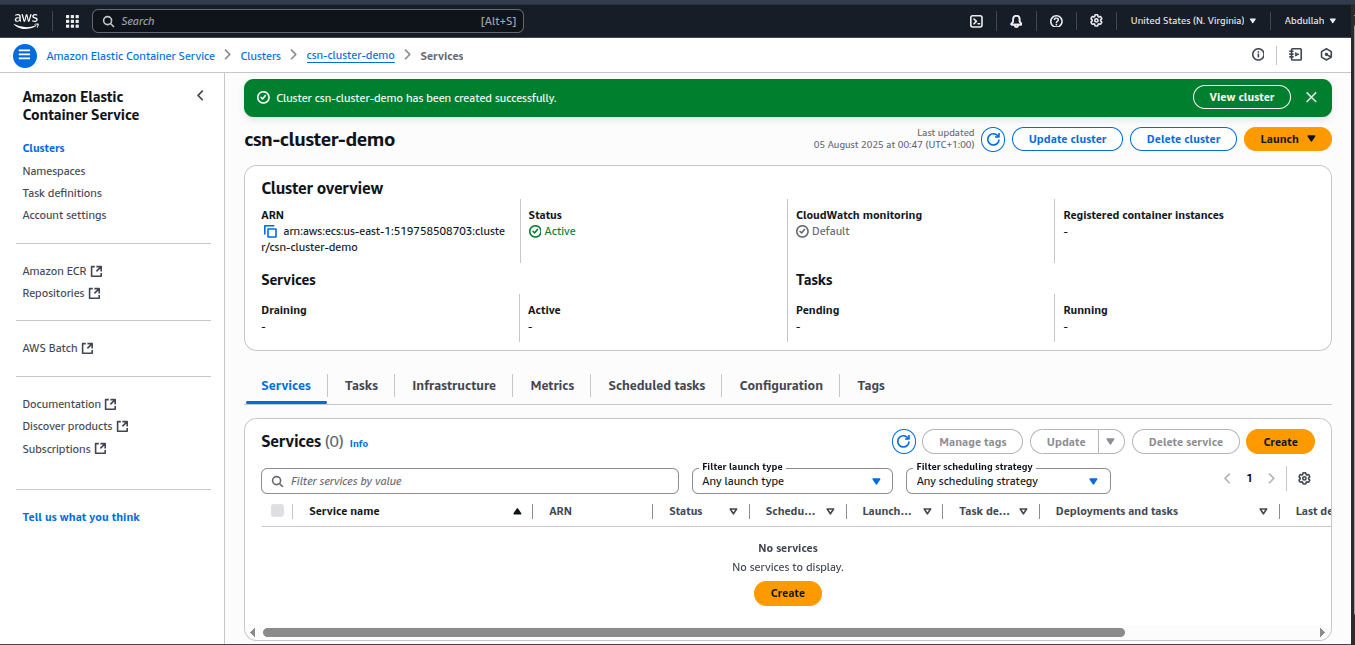
Step 1: Create the ECS Cluster
- Open the AWS Console and search for ECS
- Click on Clusters → Create Cluster
- Under Cluster configuration:
- Gave it a name:
csn-cluster-demo
- Gave it a name:
- Under Infrastructure:
- Selected AWS Fargate (Serverless)
- Left the other options as-is, then clicked Create
Step 2: Create a Task Definition
This is where I told AWS how to run the Grafana container.
In ECS, go to Task Definitions → Create new Task Definition
Choose:
- Launch type:
Fargate - OS/ Architecture:
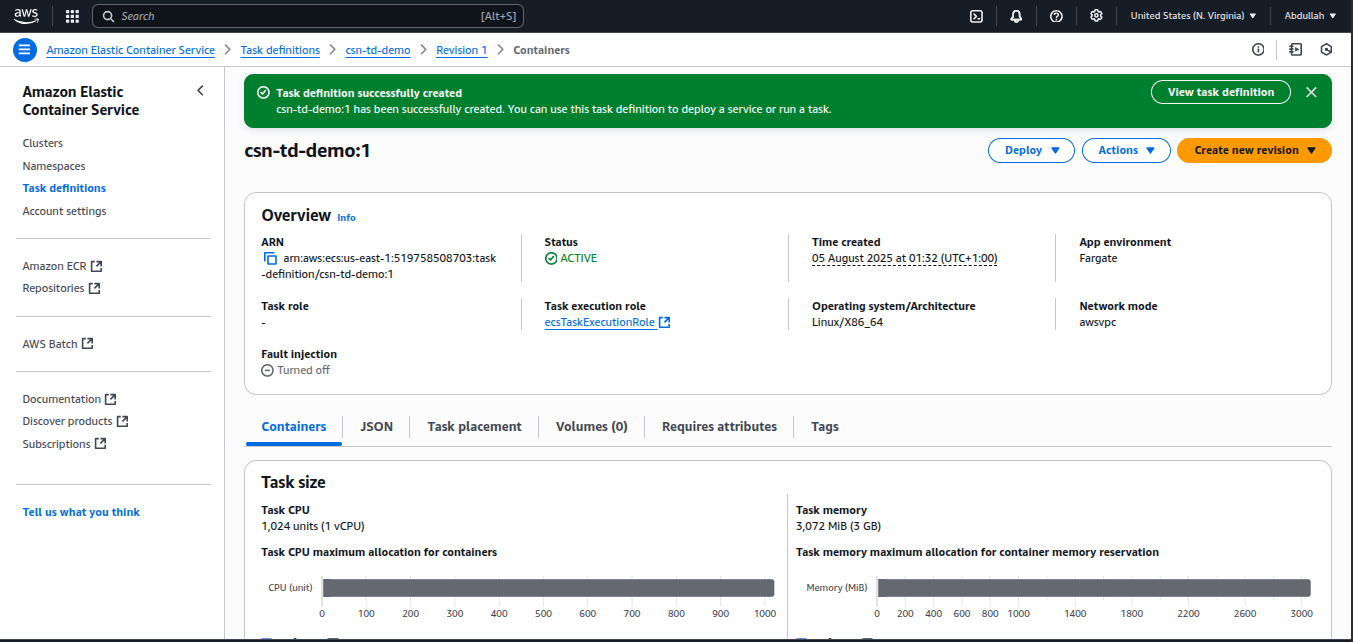
Linux/x86_64 - Task definition name:
csn-td-demo - CPU: 1 vCPU
- Memory: 3gb
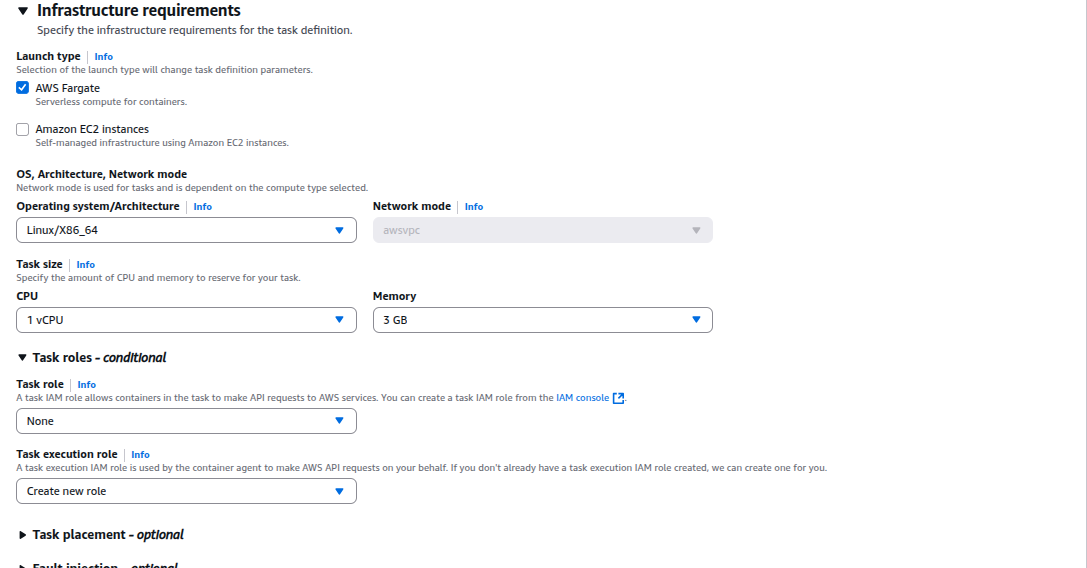
- Launch type:
Add a container:
- Container name:
grafana - Image URI:
grafana/grafana:latest - Port mapping:
3000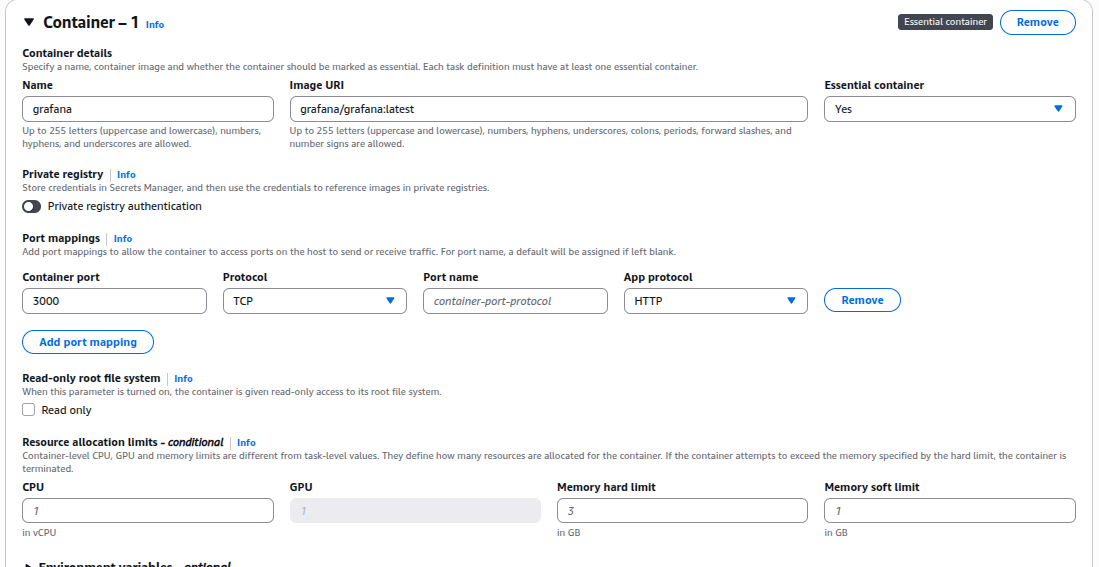
- Left the other options as-is
- Container name:
Click Create
Step 3: Create a Service to Run the Task
This part was a bit confusing at first, but here’s what I did:
- Go to the csn-cluster-demo cluster created in step 1
- Click Create under the Services tab
Choose:
- Launch type: Fargate
- Task Definition:
csn-td-demo - Task Definition Revision:
1
- Under Environments:
- Selected
launch type
- Selected
- Under Deployment Config
- Leave default settings
Under Networking:
- Selected my default VPC
- Chose a public subnet
- Enabled Auto-assign public IP
- Created a new security group that allowed:
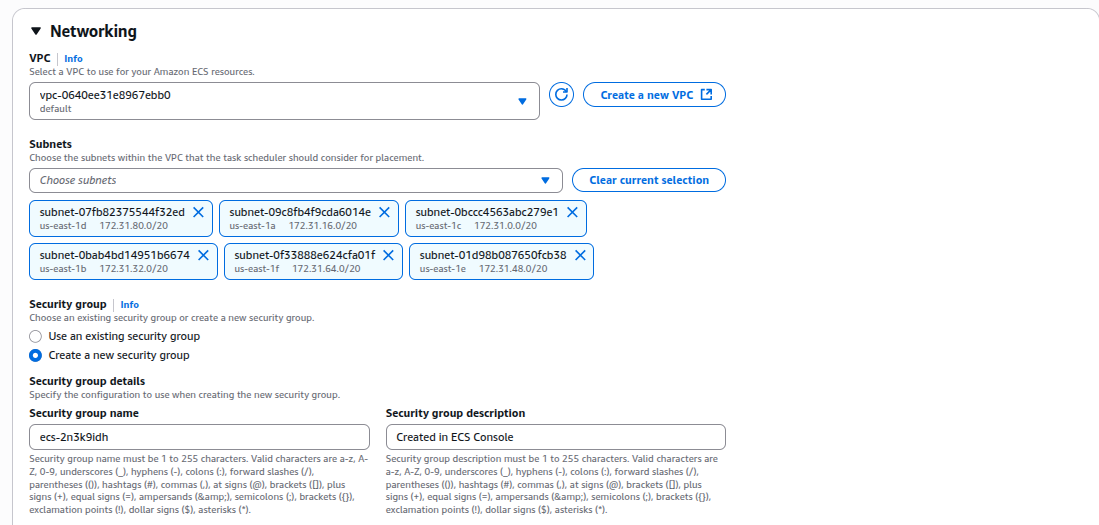
- Inbound traffic on TCP port 3000 from
0.0.0.0/0
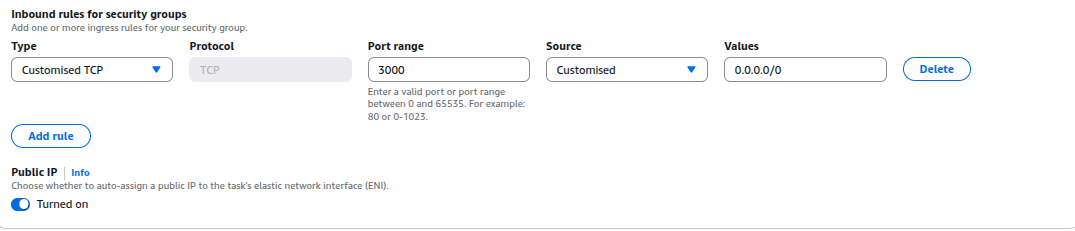
Left the rest as default and clicked Create
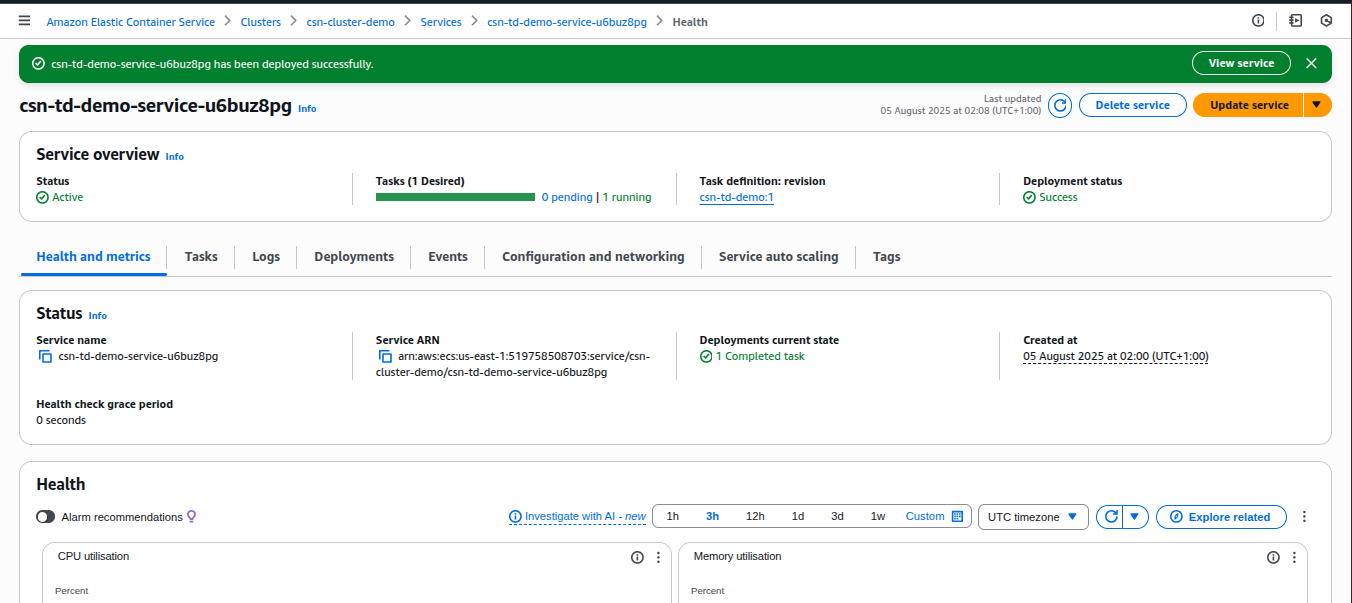
Step 4: Access Grafana in the Browser
After a few minutes, the service status changed to RUNNING.
Here’s how I accessed Grafana:
- In the Tasks tab of my service, I clicked the task
- Scrolled down to find the Public IP
- Opened my browser and visited: http://
:3000 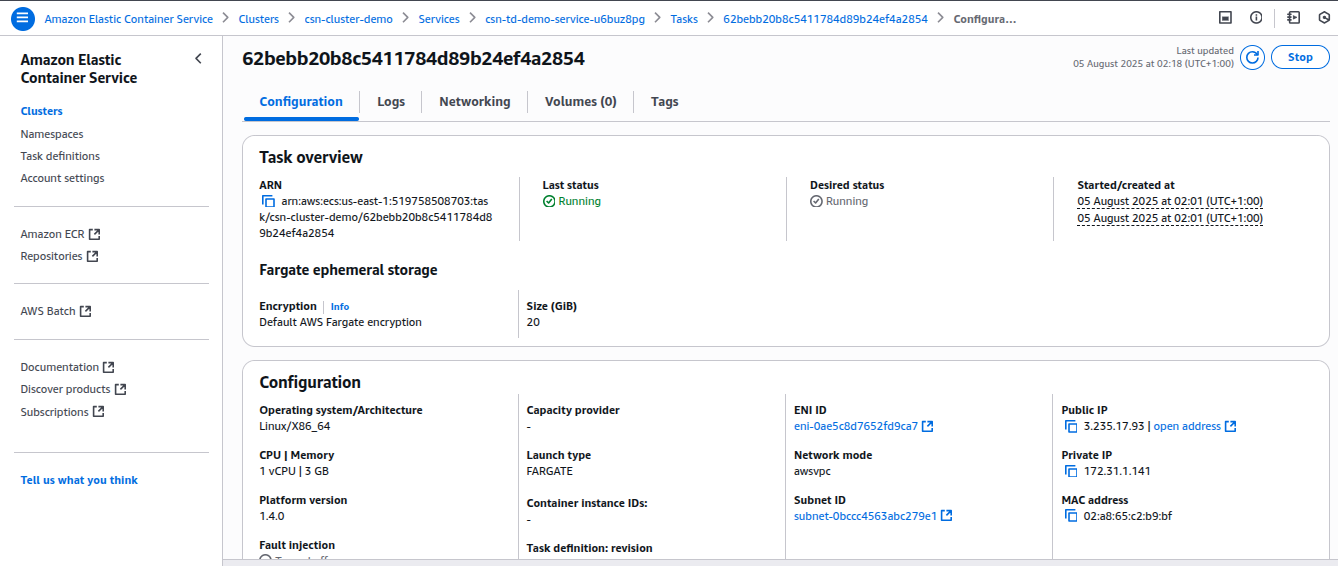
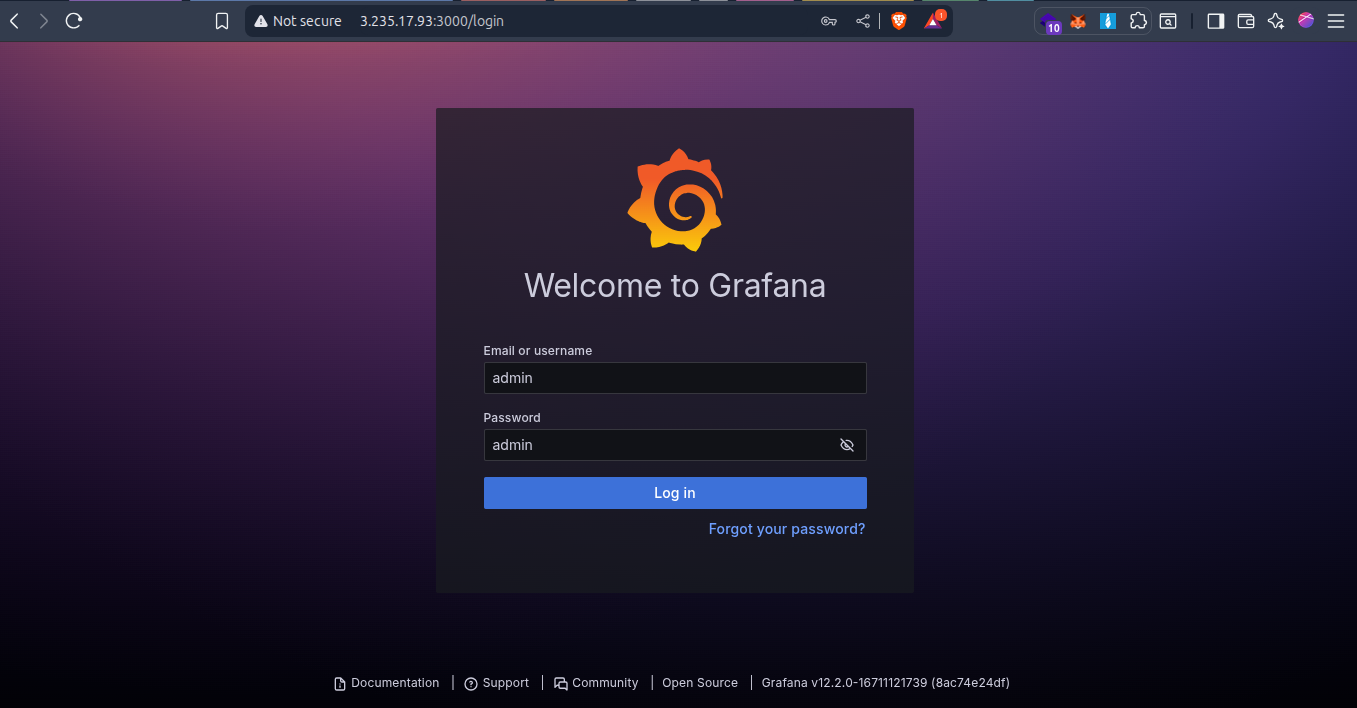
And boom, the Grafana login page appeared!
Default Login
| Field | Value |
|---|---|
| Username | admin |
| Password | admin |
You’ll be asked to change it after the first login.
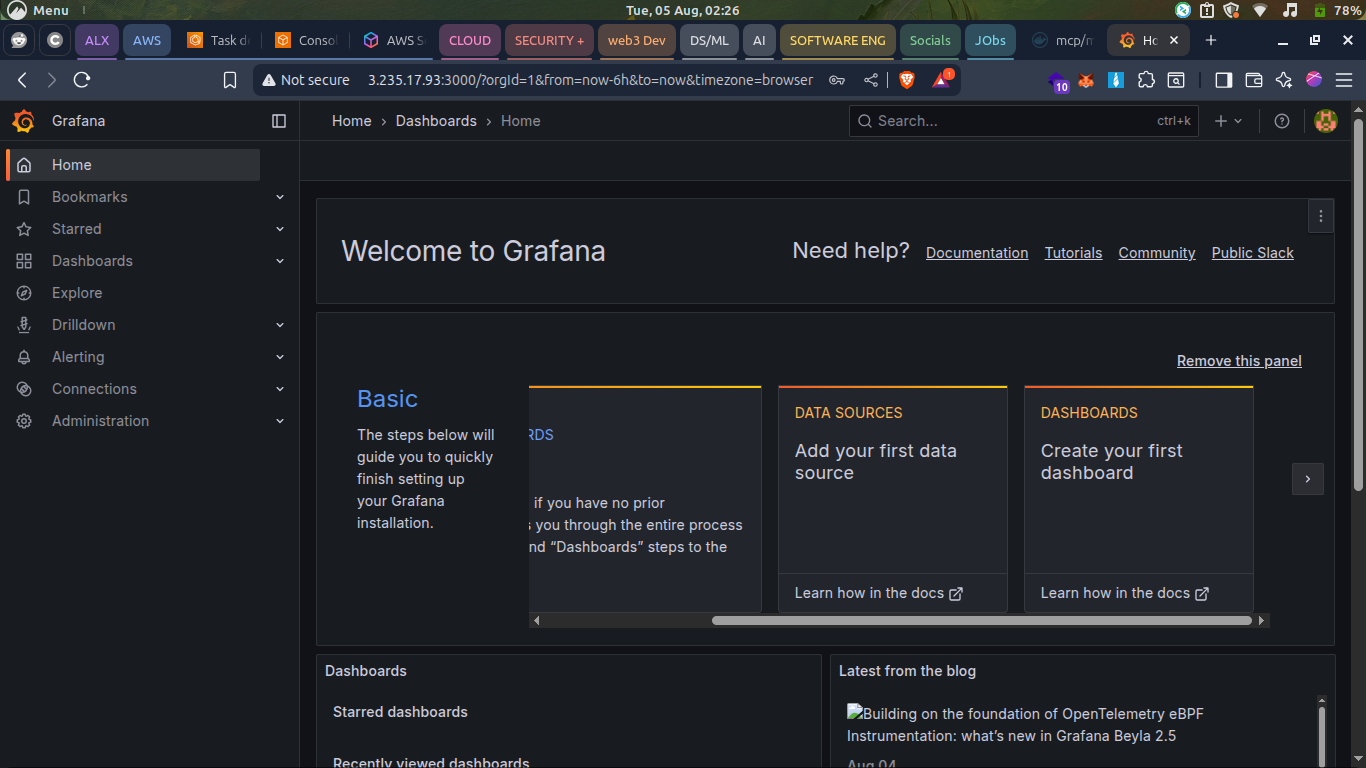
- Dashboard
What I Learned
- ECS + Fargate let you deploy containers without managing servers
- Security groups are crucial, if I had forgotten to open port 3000, Grafana wouldn’t load
- Docker Hub images can be pulled directly, no need to build your own container if one already exists
- Cloud deployment is less scary once you walk through it step by step
Final Thoughts
This was a confidence booster. I got to:
- Use AWS services I hadn’t touched before
- Work with containers in the cloud
- Deploy a real app (Grafana) from scratch
If you're just starting out too, I hope this post helps you get unstuck.
And if something doesn’t make sense, that’s okay, it didn’t for me either until I tried it myself.